In software development, it is good practice to write tests for the productive code. We see the value in our daily work in many places when it comes to further developing the software. But CI - systems, although they make the safety net possible for whole teams in the first place, are often far from the principle. Build and test configurations are all too often developed and used without a net and a double bottom. This is where I would like to start and take the proven principle even further. The article describes the setup of a tested CI system using the example of Tekton with GitHub Actions.
The article refers to a Tekton - Demo project on GitHub, where the practical implementation has been done. We will go step by step through all the building blocks and clarify the relationships, because at first glance the used “best of breed” tooling of K3d, Flux and Github Actions can be a bit confusing. The project is aligned with modern requirements in terms of bootstrapping and testability. Specifically, it means that this project can be easily built and launched on a local development environment and thus just as well in a CI system.
Tekton Cloud Native CI/CD
According to its own homepage, Tekton is a framework for building cloud native CI / CD systems and one goal is to standardize the tooling for CI / CD systems. It has already found its way into Jenkins X and is the basis for RedHat OpenShift Pipelines. The Tekton project uses Kubernetes as a platform and represents the core of the building blocks of a CI pipeline in the form of CRDs. A Custom Resource Definition (CRD) is a self-created Kubernetes object that can be used to make custom objects visible and usable within the Kubernetes API. In Tekton, for example, objects such as a “pipeline” can be found, which represents this and can be configured by “tasks”, which execute the individual process steps. The entire configuration then takes place via manifests, as is usual with Kubernetes. The existing Kubernetes know-how comes into its own here, because in addition to configuration, introspection of the processes can also take place via this path. The Tekton Hub is offered as a central point of contact for tasks and pipelines maintained by the community. Many building blocks can already be found there to cover the most common steps. In addition to the public hub, it is very easy to implement specific solutions once within your own organization and distribute them reliably. In addition to the manifests, Tekton of course also provides the Kubernetes operators that execute the configured steps. As is usual with modern CI systems, the build steps are executed within containers.
A boiled down CI Pipeline
For the following example, we need a rough understanding of the CI tool, so I will introduce the main components with which a “Hello, World!” - example is built with.
A task consists of a series of steps that are executed in order. A step is a self-contained command, which in the following example is named hello , the call to echo "Hello World!". This is started and executed in an Ubuntu container, which of course can be changed to your liking.
In real use you can find commands at this point, which do a checkout, build images and much more.
apiVersion: tekton.dev/v1beta1
kind: task
metadata:
  name: hello
spec:
  steps:
    - name: hello
      image: ubuntu
      command:
        - echo
      args:
        - "Hello, world!"
Also a goodbye task is created, which says goodbye with a echo command on the system console.
In this small example we will create a pipeline that calls the two tasks one after the other so that when looking at the pipeline logs, both the hello and the goodbye are displayed.
Very intuitively - in my opinion anyway - we create a CRD of type Pipeline and define there a list of tasks, which can be provided with dependencies among each other. In this simple example we specify via runAfter that the farewell should take place after the greeting.
apiVersion: tekton.dev/v1beta1
kind: pipeline
metadata:
  name: hello-goodbye-pipeline
spec:
  tasks:
    - name: hello
      taskRef:
        name: hello
    - name: goodbye
      runAfter:
        - hello
      taskRef:
        name: goodbye
The task defined above is linked via a taskRef so that the defined tasks are linked via it and the pipeline runs through the two steps.
Interacting with tekton
As shown at the beginning, Tekton works by configuring and installing CRDs. These API objects can be retrieved and manipulated directly via kubectl, through which a traceable API is mapped. Installed pipelines can be easily retrieved:
# kubectl get pipelines.tekton.dev –all-namespaces -o wide
NAMESPACE NAME AGE
8
tekton-pipelines hello-goodbye-pipeline 1s
9
Furthermore it is of course possible to start a pipeline. In the repository you can find a PipelineRun which I show in the following:
apiVersion: tekton.dev/v1beta1
kind: PipelineRun
metadata:
generateName: hello-goodbye-pipeline-
spec:
pipelineRef:
name: hello-goodbye-pipeline
The configuration provides a prefix for the generated runs via the generateName attribute. It also provides a reference to the pipeline to be used, which we created during the installation and looked at in the course of this article.
How to start a pipeline? Now we need another API object, the PipelineRun. This object brings the necessary parameters - in our case none yet - in connection with the pipeline to be executed. As a user, we can get the status and also the log output by reference to the generated run.
Here we go:
kubectl create -n tekton-pipelines -f ./hello-goodbye-pipeline-run.yaml
And as already indicated, we retrieve all the runs:
kubectl get pipelineruns.tekton.dev –all-namespaces -o wide
NAMESPACE NAME SUCCEEDED REASON STARTTIME COMPLETIONTIME
8
tekton-pipelines hello-goodbye-pipeline-v5h5l True Succeeded 13s 1s
Here you can see the existing status fields of this object. For black-box testing, we can therefore wait for the PipelineRun status to change to Succeeded to detect the execution of a pipeline.
The execution of a pipeline can vary in time for a variety of reasons. One way to deal with this is to pause a fixed amount of time within the pipeline and check the result after this time is reached. In practice, this is not optimal, because in addition to waiting too long, pipeline failures also occur, which are not necessary.
The Kubernetes API Tooling offers an elegant solution for this, which I would like to show with an example. For the case shown above, we can use kubectl -n tekton-pipelines wait --for=condition=SUCCEEDED=True --timeout=60s pipelineruns.tekton.dev/$PIPELINE_RUN_NAME to wait for the SUCCEEDED=True condition to occur with a maximum timeout of 60 seconds. The timeout is chosen with 1 minute very large, since this is to be reached only in the case of error. In practice, we do not wait this long.
After this maximum timeout has expired, we can then query the state of the pipeline. The alternative to this efficient wait for the status is a static long sleep on the command line. This makes the tests very slow on the one hand and can also often fail for no reason if processing stalls for other reasons.
In summary, it is important to know for the rest of the process that the status of the execution can be retrieved via the Kubernetes API. To create a stable test setup, it is important to react to status changes with time-outs and perform verifications.
In addition to direct interaction with kubectl, Tekton provides a specialized command line interface (CLI) that interacts directly with the cluster via the currently used Kubernetes context. Many Kubernetes-based tools come with a suitable CLI to work efficiently with the platform. tkn is the corresponding go binary which can be run on different platforms without any problems. Installation instructions can be found via the GitHub repository.
With this CLI it is then easier to retrieve e.g. the tasks and pipelines. Here is a short example:
tkn task list –all-namespaces
tkn pipeline list –all-namespaces
These two calls show all existing tasks and pipelines in all namespaces.
The inspection of the logs is done by this command:
tkn pr logs $PIPELINE_RUN_NAME
The output of all tasks is collected here and displayed in a traceable way.
GitHub Actions
GitHub Actions offer the possibility to build CI pipelines with little effort and use them for projects. My colleague Jonas wrote a wonderful blog post on this topic, which I gladly refer to for more information.
For this article it is important to know that the Actions also allow containerized execution of test code. Moreover, it is even possible to launch additional containers, which allows us to use a minimal Kubernetes cluster in the form of K3d within the test run.
In the demo project used, each push runs through the pipeline and the results of the run are visible under the “Actions” tab on the GitHub pages. The configuration is done as usual with other tools by a file, which is stored in the repository under .github/workflows.
Demo Project
The demo project uses Github Actions so that a build is started on every commit and push to the repository. The configuration of the pipeline can be found in .github/workflows/create-cluster.yml.
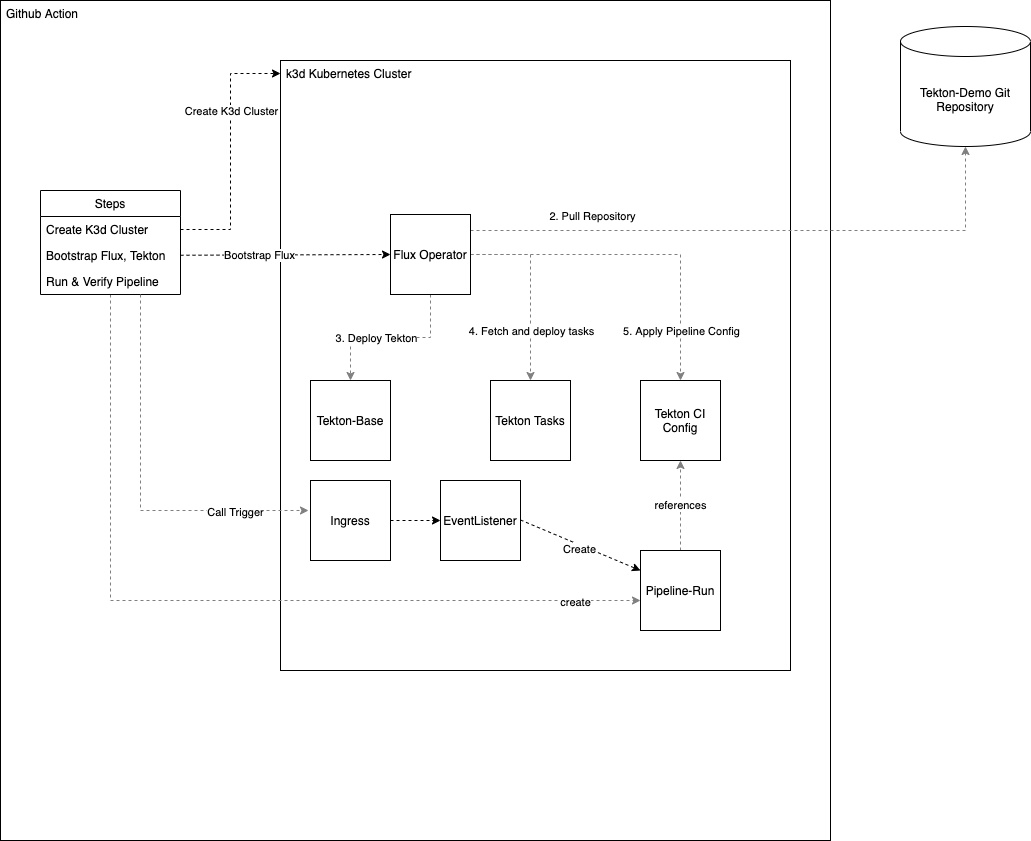 Inside the Github action, a k3d Kubernetes cluster is started. K3d starts a minimal k3s cluster which is provided by Rancher. Rancher offers with this Kubernetes distribution a minimal cluster which is optimal for CI operation, among other things. It requires very little memory and also the time to start is extremely low. This temporary cluster is used as a deployment target for the Tekton installation.
After the cluster is available, the further installation starts with Flux Which is a tool to implement the GitOps approach coined by Weaveworks. The configuration of the target cluster is managed in its entirety in git and is retrieved from there by the respective target cluster. GitOps tools and thus also Flux work pull-based compared to other declarative Infrastructure as Code - tools.
Perhaps the question arises, “Why Flux?” From my point of view, it is a tiny, flexible deployment tool that allows the installation of Helm releases and simple YAML manifests with little effort. Integration into the deployment and testing process is also quick.
Flux installs the basic components of Tekton and also the desired additional components of the pipelines. Once all the installation steps have been completed, a fully-fledged CI system is available. The installation steps are mapped in the form of
Inside the Github action, a k3d Kubernetes cluster is started. K3d starts a minimal k3s cluster which is provided by Rancher. Rancher offers with this Kubernetes distribution a minimal cluster which is optimal for CI operation, among other things. It requires very little memory and also the time to start is extremely low. This temporary cluster is used as a deployment target for the Tekton installation.
After the cluster is available, the further installation starts with Flux Which is a tool to implement the GitOps approach coined by Weaveworks. The configuration of the target cluster is managed in its entirety in git and is retrieved from there by the respective target cluster. GitOps tools and thus also Flux work pull-based compared to other declarative Infrastructure as Code - tools.
Perhaps the question arises, “Why Flux?” From my point of view, it is a tiny, flexible deployment tool that allows the installation of Helm releases and simple YAML manifests with little effort. Integration into the deployment and testing process is also quick.
Flux installs the basic components of Tekton and also the desired additional components of the pipelines. Once all the installation steps have been completed, a fully-fledged CI system is available. The installation steps are mapped in the form of customizations which thus define the installation sequence of Kubernetes manifests. In this demo project, the Flux installation starts in clusters/local/ and progresses from there through further references to installation files.
The process outlined above runs autonomously and asynchronously. How can you tell in the CI - process when the cluster is deployable? Determining this moment reproducibly, as error-free as possible and precisely is very important for testing, because otherwise there are always false positives in the pipeline, which would greatly reduce its acceptance by the using teams.
A fundamental problem is that the status of the Flux deployment is made available via a CRD, which itself is installed and made available by Flux.
With on-board means of kubectl wait it is not possible to wait for a status change of a possibly not yet existing CRD, therefore the step “Wait for Flux CRD Deployment” was used. After this run, kubectl wait commands are used to wait for the successful run of the individual Flux customizations. When this has been achieved, the actual testing can begin.
The Testing
From here on, it’s all about the test run in the ready-made K3d cluster. We start a Tekton pipeline by creating a PipelineRun as follows:
apiVersion: tekton.dev/v1beta1
kind: PipelineRun
metadata:
generateName: hello-goodbye-pipeline-
spec:
pipelineRef:
name: hello-goodbye-pipeline
Interesting here is that the PipelineRun is generated according to a simple naming scheme configured via generateName. The prefix specified here is extended by a unique id by the system. The desired pipeline is specified via pipelineRef. For our simple case a sufficient configuration. More complex pipelines can have additional parameters and workspaces added here.
- name: Execute and verify hello-world pipeline is run to completion
run: |
PIPELINE_RUN_NAME=$(kubectl create -n tekton-pipelines -f ./hello-goodbye-pipeline-run.yaml -o json | jq -r ‘.metadata.name’)
kubectl -n tekton-pipelines wait –for=condition=SUCCEEDED=True –timeout=60s pipelineruns.tekton.dev/$PIPELINE_RUN_NAME
tkn pr –namespace tekton-pipelines logs $PIPELINE_RUN_NAME
The PipelineRun shown above is started by the test and the generated name is read from the API with the Swiss Army Knife jq.
Now we just wait for the pipeline to run successfully and report back a success if this is met.
kubectl -n tekton-pipelines wait –for=condition=SUCCEEDED=True –timeout=60s pipelineruns.tekton.dev/$PIPELINE_RUN_NAME
The GitHub Actions - Job is green when the pipeline has been successfully run.
Recap
With the approach described here, we have automated the testing of an entire CI system from the ground up. No more unpleasant surprises when a small change in the pipeline causes unwanted effects or the system has to be rebuilt. The tests are always running and make it possible for us to develop this part of the infrastructure like a product. If you have comments or questions feel free to contact me.